
The results from thousands of studies available in a free database at clinicaltrials.gov. However, they all use different outcome measures, so it’s difficult to aggregate the results to generate meta-analyses. Thus, it’s difficult for a patient or physician to derive the best actionable information from this disparate pile of information.
Our goal is to convert all of these outcome measures to a standardized effectiveness score to automate their aggregation into meta-analyses.
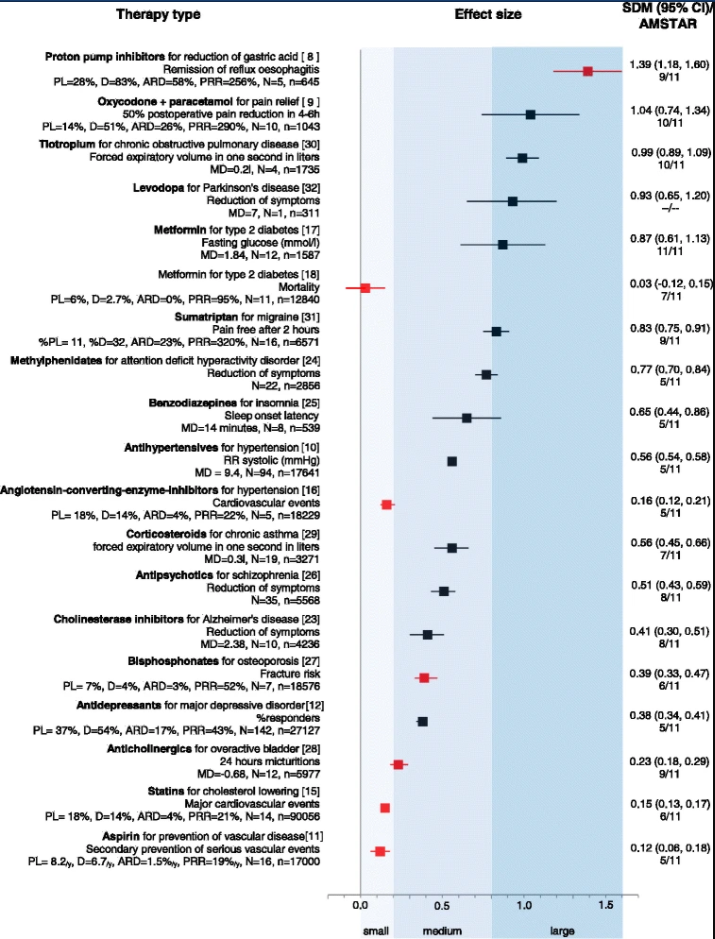
How to Measure and Compare Treatment Effectiveness
- Absolute risk or response difference (ARD) is the risk or percentage of responders in group B subtracted from the risk or percentage of responders in group A. For example, mortality was 2 % for drug treatment and 4 % for placebo, which gives an ARD = |-2 %|. For responder rates, if 45 % of patients responded in the drug group and 30 % in the placebo group, the ARD is 15 %.
- The percentage response ratio (PRR) is the percentage of responders in group A divided by the percentage of responders in group B. For example, if 45 % of participants responded to drug treatment in group A and 30 % to placebo in group B, the PRR is 50 %, because 0.45/0.3 = 1.5. This means that there were 50 % more responders in group A compared to group B.
- Mean difference (MD) is the mean from group B subtracted from the mean in group A. For example, if the mean total sleep time at the end of treatment in the drug group was 5 hours and 10 minutes and in the placebo group 4 hours and 55 minutes, the MD is 15 minutes.
- Standardized mean difference (SMD) is the mean from group B subtracted from the mean in group A and divided by the pooled standard deviation (SD). For example, if the average weight of participants at the end of treatment was 79 kg in the drug group and 83 kg in the placebo group and the pooled SD was 8 kg, the SMD is 0.5.
Sources
https://bmcmedicine.biomedcentral.com/articles/10.1186/s12916-015-0494-1